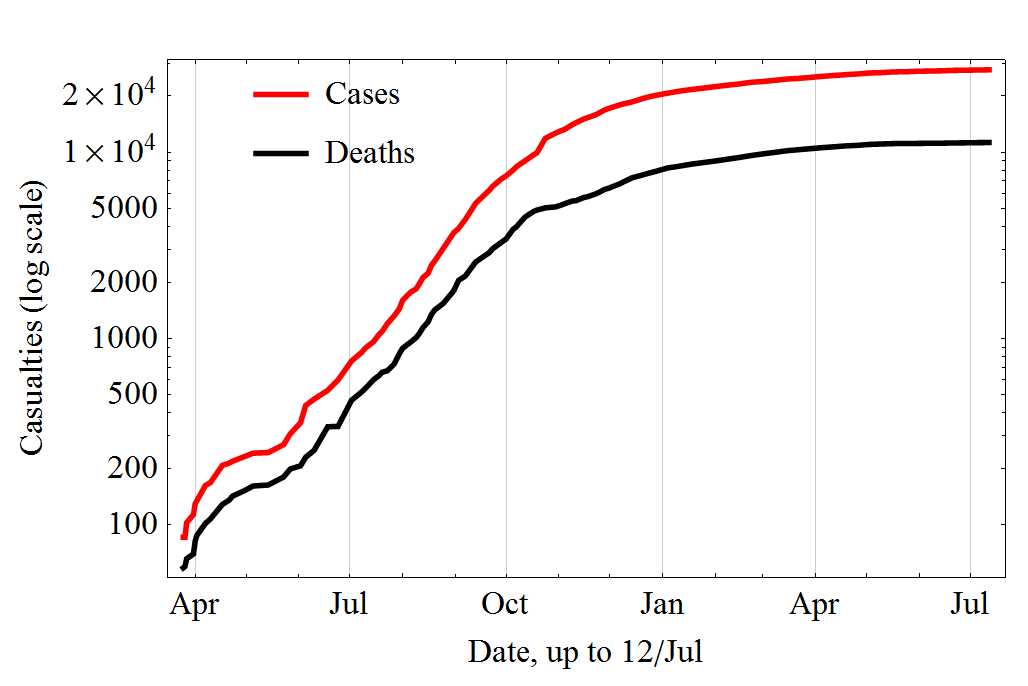
(It's easier to recognize a straight line on a log scale, than to distinguish an exponential line on a linear scale from a line that's "merely" quadratic, say.)
Here's one of the previous largest outbreak, 2000-2001 in Uganda. (Note unlike the Wikipedia one, it's not cumulative). Looks like a sudden decline in new cases right after a CDC intervention -- very sharp inflection point. The cumulative version would be roughly a sigmoid.
Looks like there were about 10 new cases/day at its peak; the current outbreak is at 150/day.
A couple things stood out to me:
    Fourteen (64%) of 22 health-care workers in Gulu were
    infected after establishing the isolation wards; these
    incidenses led to the reinforcement of infection-control
    measures.
So that's not novel to the current outbreak at all!
    During the 4-month outbreak and response period,
    approximately 5600 contacts in Gulu District were under
    surveillance for 21 days by approximately 150 trained
    volunteers.
http://en.wikipedia.org/wiki/File:Diseased_Ebola_2014.png